On the device
DCPro in action
The floor-plan heat-map tool on .NET MAUI. Click any screen to enlarge.
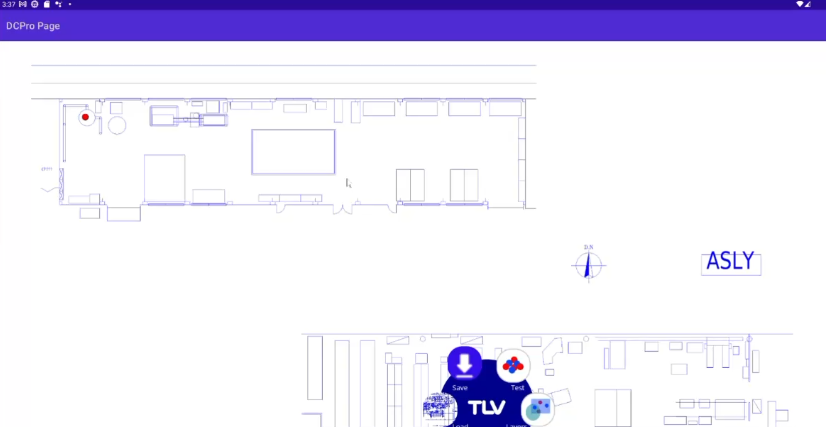
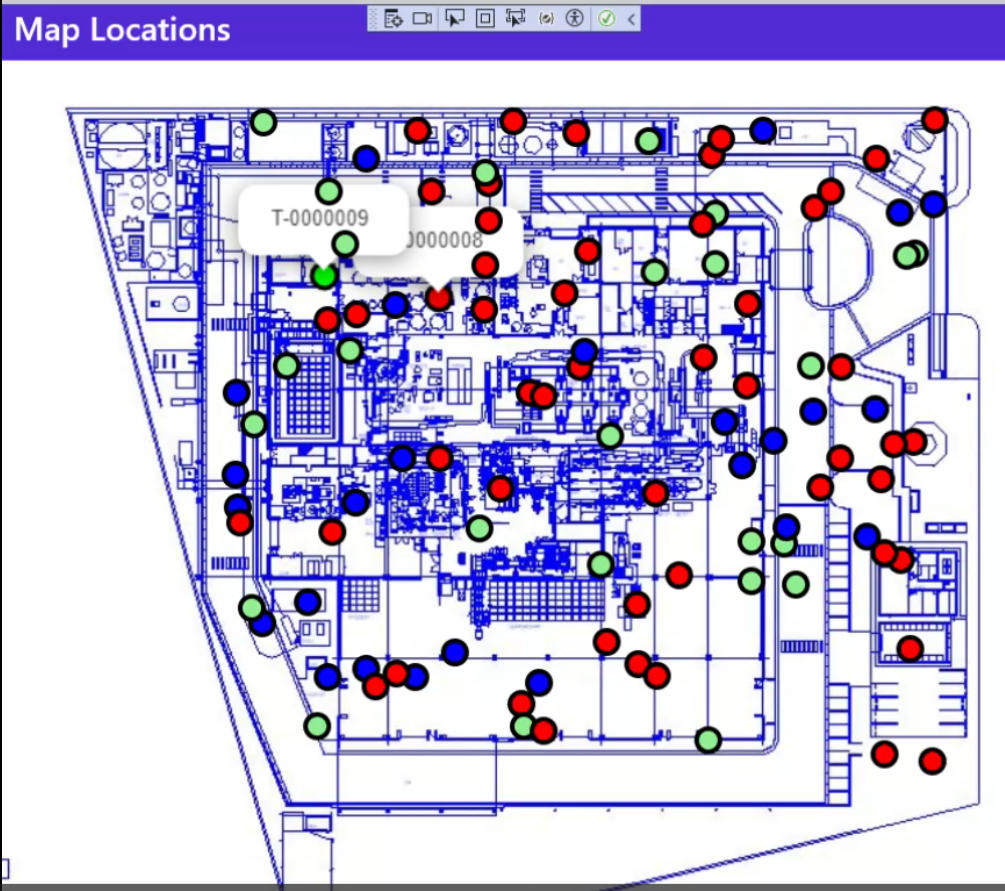
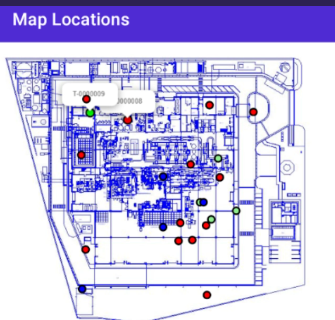
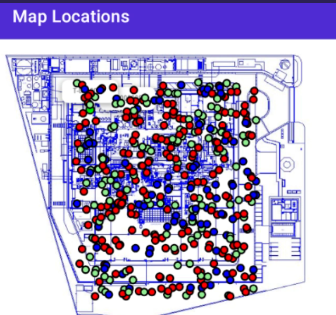
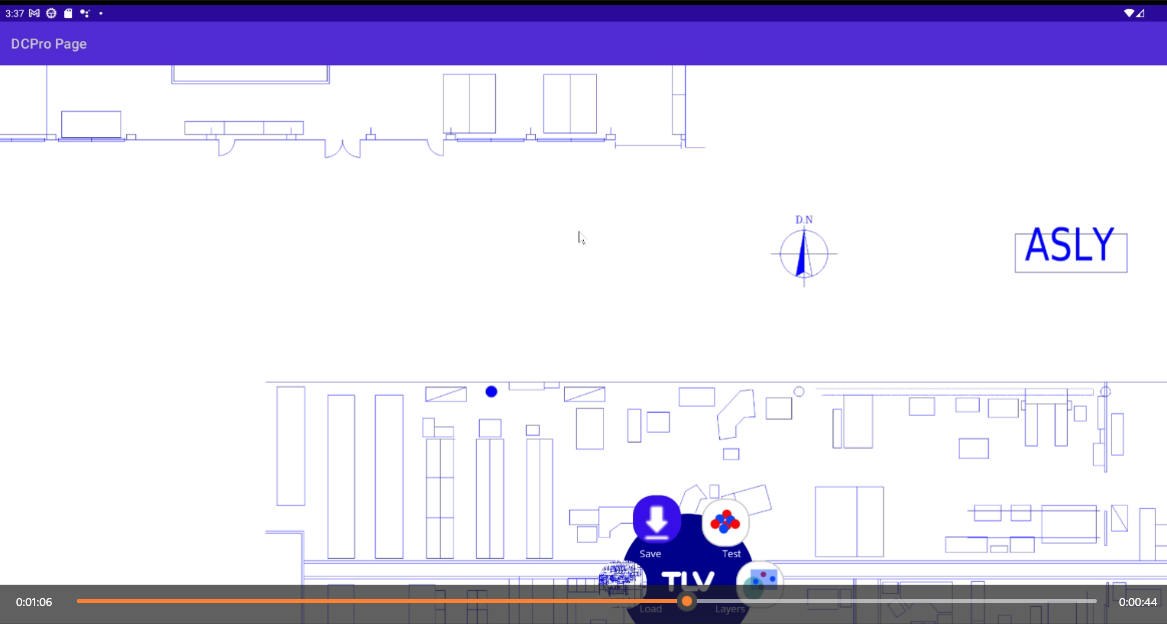
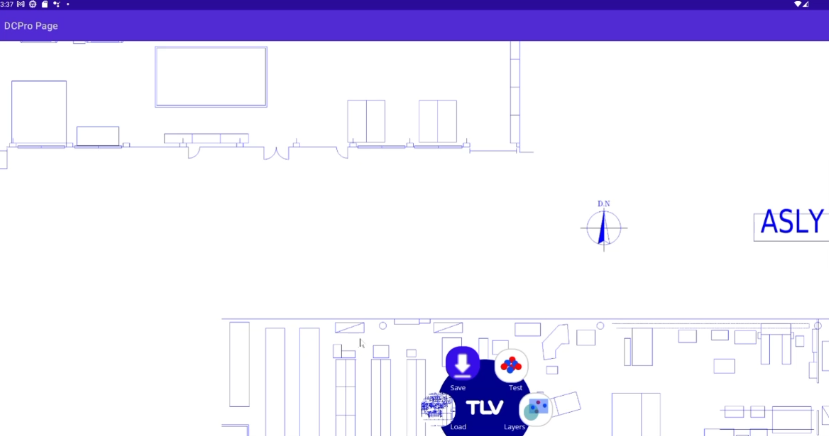
Turn a dry-cleaning floor plan into a live heat map — instantly identifying locations of heat spots and areas of unexpected energy dissipation, so problem zones surface before they cost you.
A dry-cleaning facility is a choreography of foot traffic and heavy equipment — presses, cleaning machines, conveyors, a busy front counter. When something bottlenecks or a zone runs too hot, it quietly drains time, energy and money. But it's hard to see a pattern by standing in the room.
DCPro turns the floor plan itself into the dashboard. It maps a facility's layout, then paints a heat map over it — revealing the high-traffic paths and equipment zones at a glance, so owners can pinpoint the real problem areas and act.
I built DCPro on .NET MAUI — designing the floor-plan mapping and the heat-visualization experience into a fast, cross-platform tool.
Every colour is a signal. The hottest zones are where attention — and opportunity — concentrate.
The busiest, hottest zone — heavy equipment running back-to-back. A prime target for layout and workflow tuning.
Steady customer flow lights up the counter — helpful for staffing and queue design.
Quiet, cool zones reveal space that could be reclaimed or repurposed.
Switch the lens to see how people move — and where the machines concentrate — across the very same plan.
Lay out the facility's rooms, stations and equipment.
Capture traffic and equipment-zone activity across the plan.
DCPro paints a heat map over the floor, high to low.
Spot the problem zones and rework layout, staffing or flow.
Model a dry-cleaning facility's layout, rooms and equipment.
A smooth low-to-high heat map painted right over the plan.
See exactly where foot traffic clusters across the floor.
Surface where machines run hottest and hardest.
Let the hottest zones point straight to the issues that matter.
The whole tool, on iOS and Android from one .NET MAUI codebase.
The floor-plan heat-map tool on .NET MAUI. Click any screen to enlarge.
A cross-platform .NET MAUI application that turns facility floor plans into interactive heat maps, surfacing high-traffic and equipment zones on iOS and Android.